

Give students timely feedback with a leaderboard
/ Turning something into a game does not necessarily mean people will suddenly like it. Atari learned this the hard way with their E.T. video game. It turns out that betting the farm on a mediocre video game based on a blockbuster movie is bad business.
The same is true with gamification, a term being thrown around a lot these days in education circles. The general idea behind gamification is that game mechanics can be used in non-game environments in order to get some of the same outcomes typically associated with games, such as engagement, problem-solving, cooperation, and motivation. Many teachers are applying the principles of game mechanics to course design in order to motivate their students in ways traditional instruction does not.
If a teacher wants to be successful at implementing gamification mechanics in the classroom, there are a few principles that must be addressed. Foremost, the game must be well designed with clear goals, rules, and roles. Kind of like teaching. In my own experience, another aspect of a successful game (and teaching) is timely feedback. In order to make good decisions that help the player keep moving forward, they need to know where they stand. There are many popular activities that rely on the concept of leaderboards, which have the dual role of informing players where they stand and creating drama for both players and observers. Figure skating, gymnastics, X Games, freestyle skiing, golf, and diving are just a few of the sports that use leaderboards.
Leaderboards can be applied to educational settings as well, but there are very few tools available that teachers can use to create and use them efficiently. One such tool is Leaderboarded, but it is not free and seems be designed more for business than education. After looking around and not seeing many options for my own leaderboard, I decided to do what I do best: build one using Google tools. Below are the steps to help you get started on your own leaderboard. You can also view an example of my leaderboard spreadsheet, and feel free to copy it into your Google Drive if you want to see my formulas for each column and worksheet.
Step 1: Create your point structure
Before you can have a leaderboard, you have to decide where the points are going to come from. You have lots of options for students to earn experience points, quest points, or any other kind of value that can be added to the total. I kept it simple and based my point total on attendance and modules completed. Every time a student is on time to class, they get 100 points. They get 50 if they are late, and zero points for missing class. Even if the student is sick. I'm playing for keeps here, folks.
Step 2: Set up your spreadsheet
I have found that I am more likely to keep my leaderboard updated if I have very few values to keep up with. The more complicated the "game" becomes, the more there is to enter. Personally, once I start feeling overwhelmed I am likely to get behind on entering values. The more behind I get, the more irrelevant the leaderboard becomes. So, keep it simple.
As you can see from my example, I created a separate sheet for each set of points. One for attendance and one for modules. I used the SUM and COUNTIF functions to tally the values for each sheet. I chose to use the digit 1 instead of 100 or 50 because it is easier to enter. I can have the spreadsheet multiply by 100 on the Participation worksheet so I don't have to.
You will use the Participation sheet to add up all of your totals from attendance and modules. This worksheet is important to include because you will use a pivot table to create the actual leaderboard, and you must have all of your points on one sheet to do that.
Step 3: Create a pivot table
What is a pivot table, you might ask? Well, it is a data analysis tool built into most spreadsheets that lets you sort, add, average, or do other functions with the data in your spreadsheet. For this example, we are going to use the pivot table to display each student's total points and rank them from highest to lowest. Here is a screenshot of what this pivot table will look like when it is all set up.

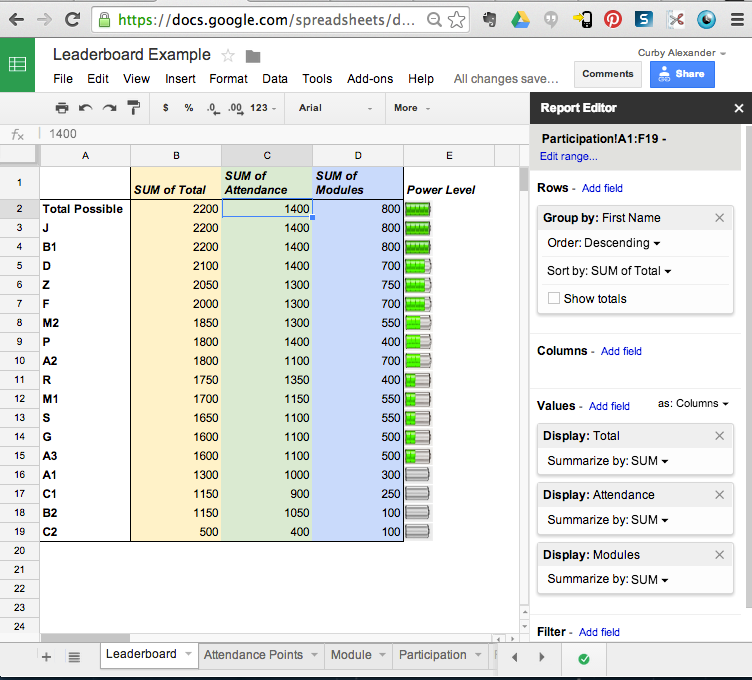
Make sure every student in your leaderboard has a unique name, otherwise the pivot table will combine the totals for both students with the same name. I used numbers to keep the first initial separate. You will notice I have a battery icon for each student. I did this by creating a Rank worksheet and using the VLOOKUP function to apply the correct icon based on the student's total points. I did this more as an experiment. If you embed this spreadsheet using HTML, the images will not show up, so don't get your hopes up.
Step 4: Share the sheet with students
At this point, you have several options for how to share your leaderboard.
Option 1: The Whole Spreadsheet
The simplest option is to share the link with the class or embed using the iFrame code Google gives you. If you share the entire sheet with the class, which I DO NOT recommend, you will want to protect your functions and make sure it is only viewable to those with the URL. If you choose to embed the entire spreadsheet, go to File --> Publish to Web. This will share your entire spreadsheet, so you need to make sure there isn't any sensitive information that you don't want the whole class to see. If you use icons for levels like I have done, they will not show up when you embed.
Option 2: One Worksheet from the Spreadsheet
If you only want to embed the leaderboard, you can use a special URL to show only the page you want. It looks like this, and I will show you how to plug in the appropriate values.
<iframe src="https://docs.google.com/spreadsheets/d/[Spreadsheet ID]/htmlembed?gid=[worksheet ID]&single=true" height="1000" width="100%"></iframe>
Here is where you find those values in RED:

This will embed only the sheet you want to share, but it will not show any images you have in the cells.
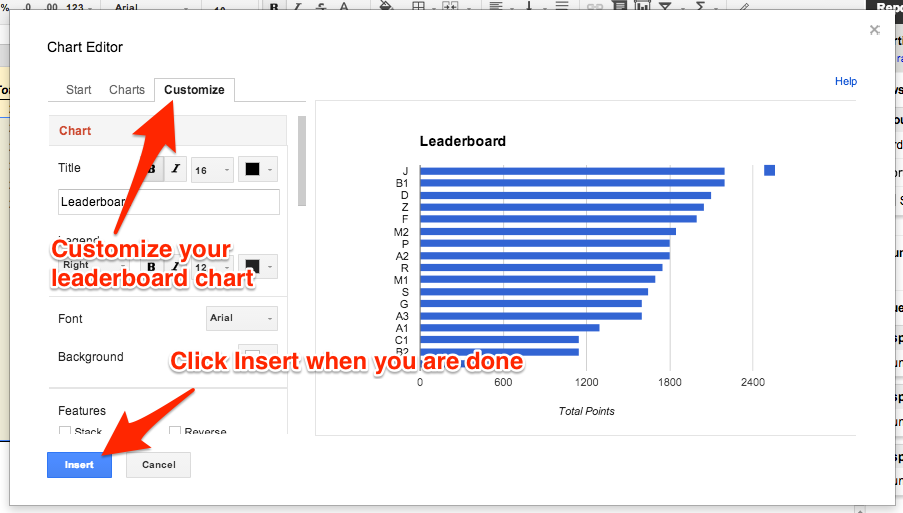
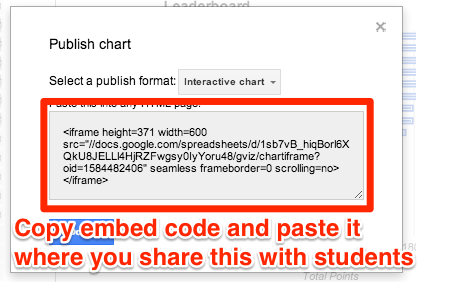
Option 3: Interactive graph from Spreadsheet
A final option for sharing the leaderboard is to create an interactive chart from the leaderboard and embed that wherever students will be looking for updated results. Here is how you do this:


And that is how you do it. This will take some tinkering, especially if you are not familiar with spreadsheet functions or pivot tables. I spent quite a bit of time messing around with this until I got it to work just how I wanted. I need to give credit where it's due for giving me this idea. I got the original idea from the EIPS Technology Blog, and I modified my leaderboard based on this design.